


How about some more geeky data...
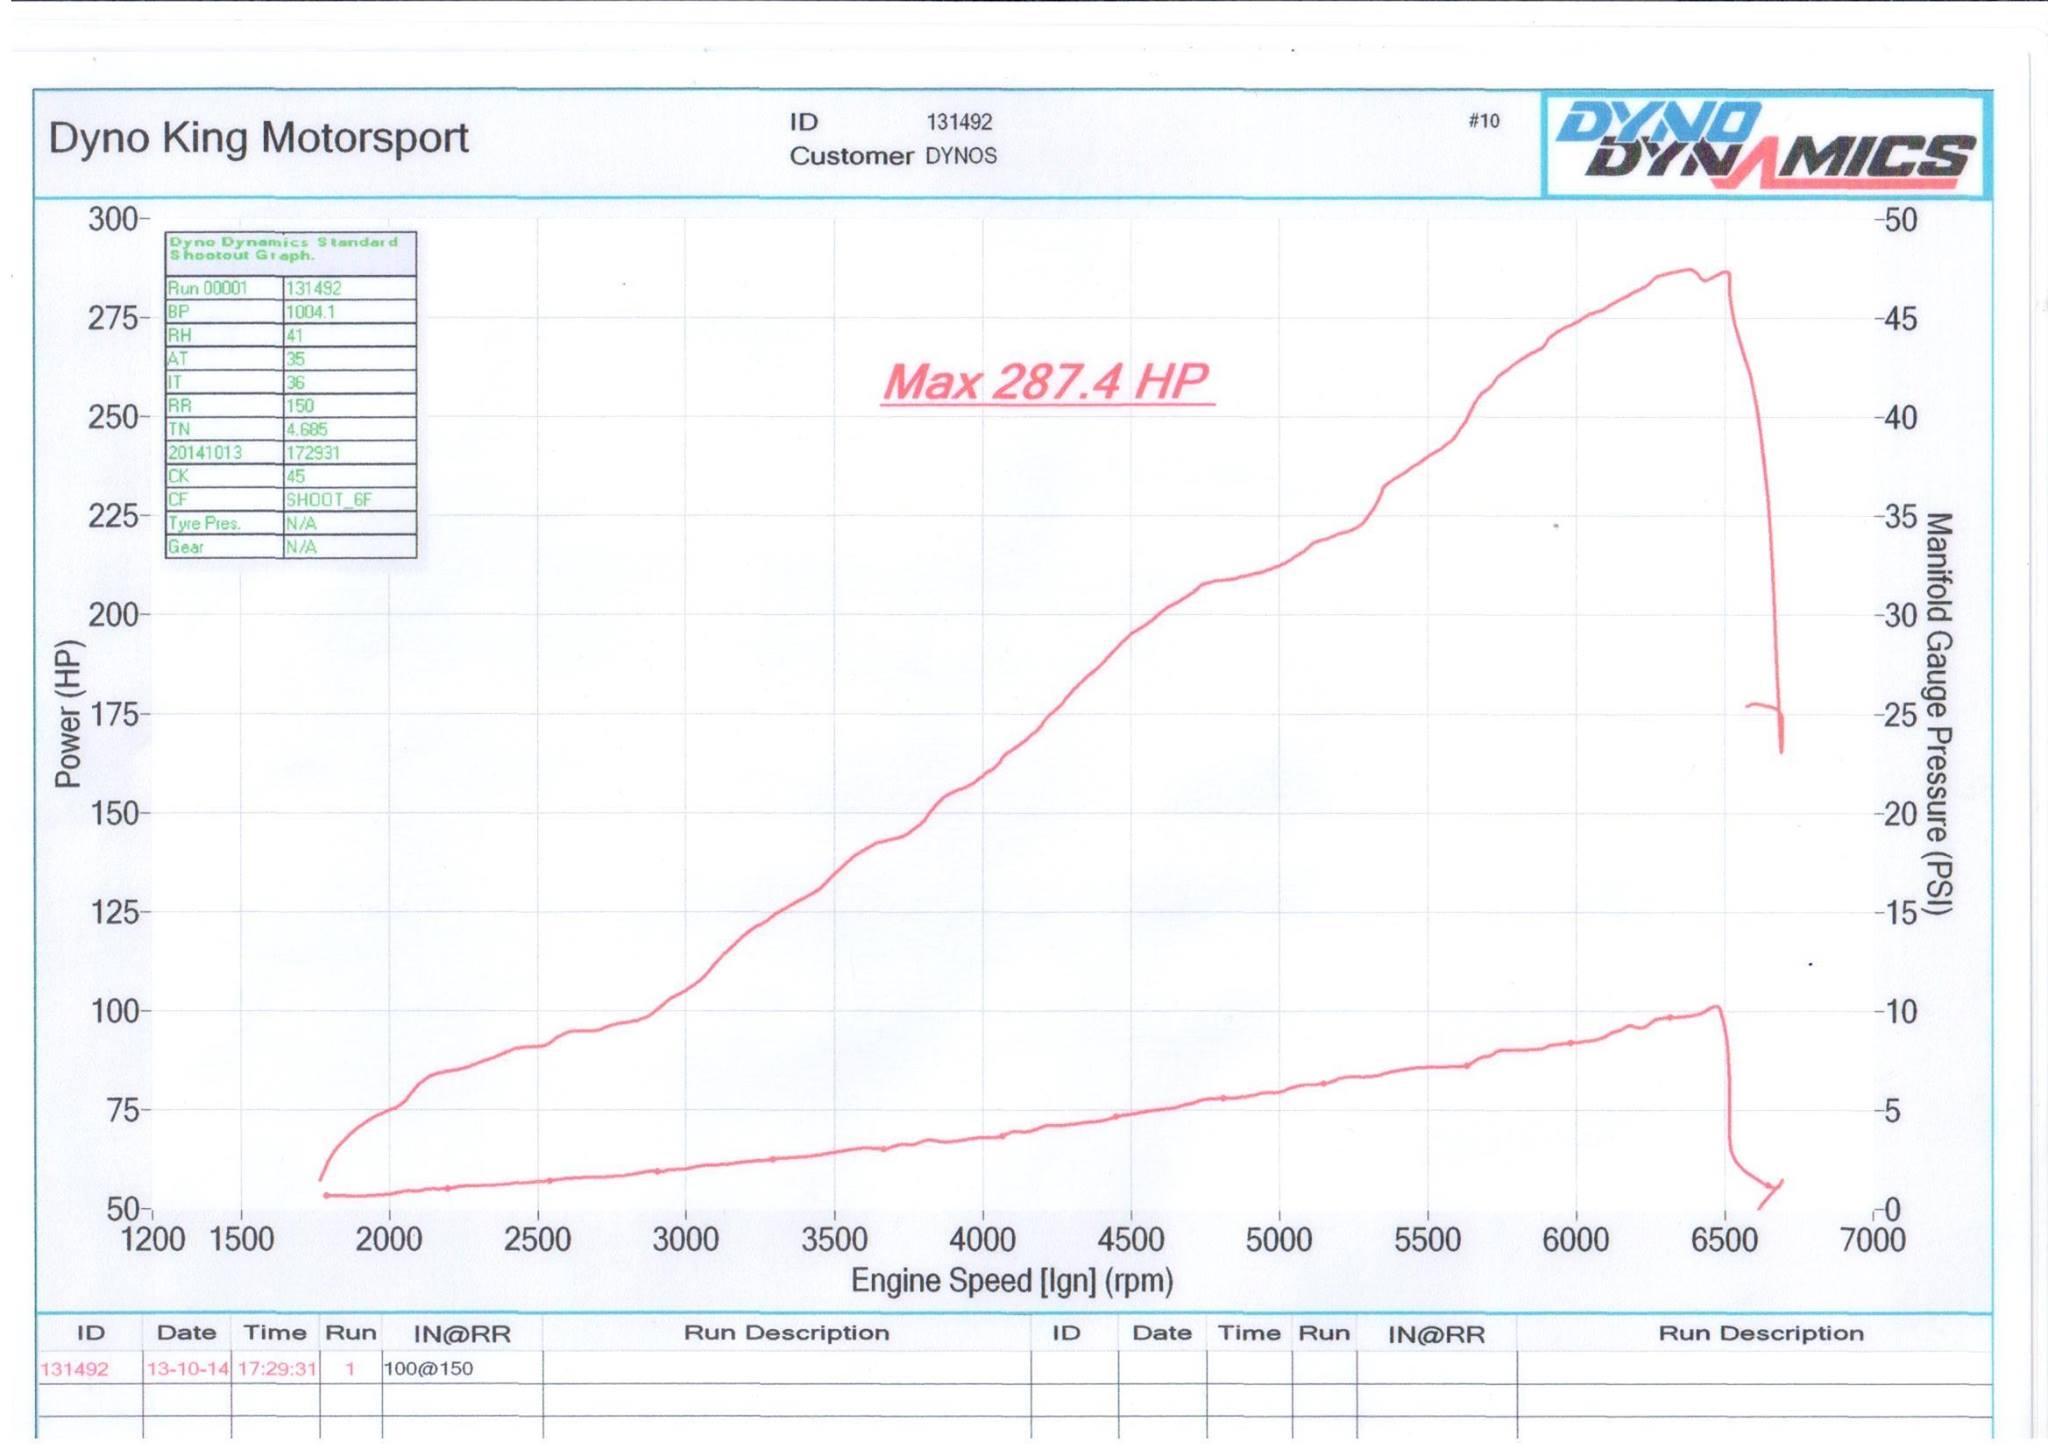
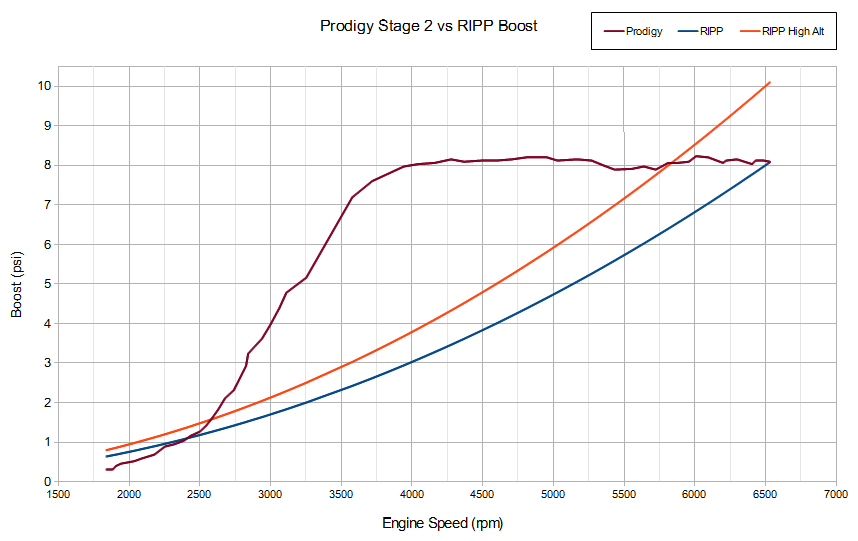
So I was looking at a dyno chart of a RIPP supercharged Wrangler with a boost curve again, and I figured out that the boost curve just about perfectly matches a quadratic curve. That means I can now plot the RIPP boost curve on a chart with my turbo boost curve.
Here's the RIPP dyno chart again:
That must be the "high altitude" kit, since it is advertised to produce 9-11 psi at sea level. The standard kit is advertised as 8 psi, so i can plot that as well.
It's interesting that there's not a lot of difference between the standard RIPP and Prodigy at low rpms.
More interesting is that RIPP just claimed on another forum today that their kit produces 40% gains as low as 1800 rpm. How do they get 40% gains from less than 1 psi boost? And if RIPP can do that, why doesn't the turbo produce 40% gains as low as 2200 rpm, where it has similar boost as RIPP at 1800?


 Reply With Quote

Connect With Us